The Importance of Monitoring and Observability in Containerized Environments
Imagine launching a new application that can handle thousands of users in a matter of seconds—only to find that it crashes under the pressure. In today’s fast-paced digital landscape, the ability to scale applications swiftly is a game changer, yet it comes with its own set of challenges. Containers have emerged as the backbone of modern application development, offering unparalleled flexibility and speed. However, this agility can often obscure visibility into the performance and health of your applications.
In the realm of containerized environments, effective monitoring and observability are not just nice-to-haves; they are essential for ensuring your applications thrive. Without these critical insights, organizations can struggle to detect performance issues, maintain security compliance, and optimize resource usage. In this blog, we’ll explore the key AWS tools that help monitor containerized applications, providing step-by-step instructions to set them up, complete with screenshots for clarity.
Why Monitoring and Observability Matter
In containerized environments, applications are packaged in lightweight, isolated units that can spin up or down within seconds. While this is a major advantage, it complicates tracking performance and maintaining stability. Without effective monitoring and observability, teams may face several challenges:
- Detect Performance Issues: Rapid scaling and ephemeral nature make identifying bottlenecks difficult.
- Maintain Security Compliance: Growing numbers of containers increase security risks; monitoring is essential for compliance.
- Ensure Application Health: Quick failures can occur without clear visibility into root causes.
- Optimize Resource Usage and Control Costs: Dynamic resource allocation requires monitoring to avoid underutilization or overconsumption, optimizing costs.
Observability enhances basic monitoring by providing deeper insights into system behavior through data collected from logs, metrics, and traces. AWS offers specialized tools to simplify this process, ensuring your containerized applications run smoothly.
AWS Tools for Monitoring and Observability in Containers
Managing containerized applications requires robust monitoring tools. AWS provides a suite of services designed for this purpose, enabling real-time performance monitoring, troubleshooting, security enhancement, and cost optimization. Today, we will focus on Amazon CloudWatch Container Insights, a tool that offers detailed visibility into your containerized applications.
Amazon CloudWatch Container Insights: Your Key to Deep Visibility
Amazon CloudWatch Container Insights delivers in-depth visibility into containerized applications and microservices running on Amazon Elastic Kubernetes Service (EKS) and Amazon Elastic Container Service (ECS). It streamlines the collection, aggregation, and analysis of performance metrics and logs, providing critical insights into the health and resource utilization of your workloads.
Container Insights collects performance metrics as structured log events in a standardized JSON schema, facilitating efficient data ingestion and storage, even at scale. The log data is aggregated into meaningful metrics at various levels—cluster, node, pod, task, and service—available directly in CloudWatch for monitoring and alerting.
Key Features of CloudWatch Container Insights
- Preconfigured Dashboards: These dashboards offer a clear, real-time view of critical metrics, allowing you to identify potential issues before they impact users.
- Granular Metrics: Metrics are generated at multiple levels, providing fine-grained visibility into resource utilization, including CPU, memory, and network usage.
- Multi-Model Support: Container Insights supports various deployment models, including self-managed and managed node groups and AWS Fargate profiles.
- Cost-Efficient Monitoring: You can selectively generate metrics to align with your needs. Additionally, CloudWatch Logs Insights enables deep analysis of raw log data for custom troubleshooting.
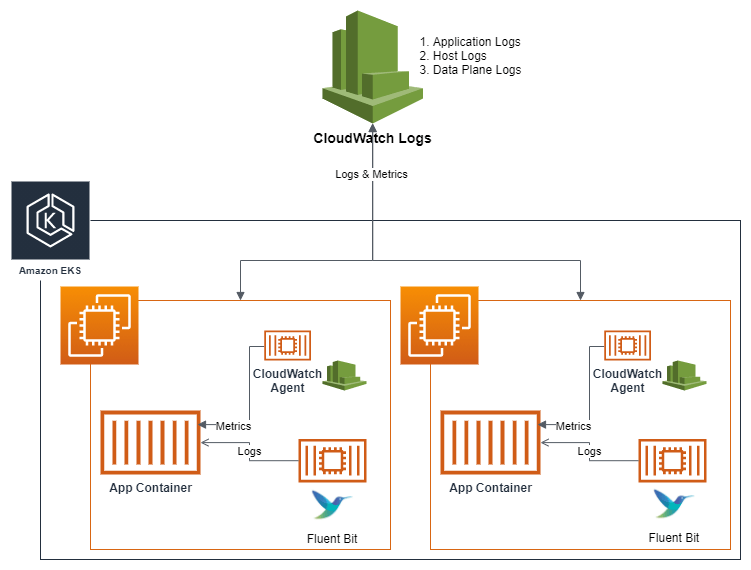
Architecture
Below is the architecture diagram that shows the components that are involved in collecting logs and metrics from your EKS environment.
How to Set Up Amazon CloudWatch Container Insights
Step 1: Create an IAM Role for EKS Pods
- Create an IAM Policy for CloudWatch Logs and Metrics:
- First, you’ll need to create a policy that allows your pods to send metrics and logs to Amazon CloudWatch.
- Go to the IAM Console → Policies → Create policy.
- Use the following policy to allow CloudWatch actions:
{
  "Version": "2012-10-17",
  "Statement": [
    {
      "Effect": "Allow",
      "Action": [
        "logs:CreateLogGroup",
        "logs:CreateLogStream",
        "logs:PutLogEvents",
        "logs:DescribeLogStreams",
        "cloudwatch:PutMetricData"
      ],
      "Resource": "*"
    }
  ]
}
2. Create an IAM Role for EKS Pods:
- Go to Roles → Create role.
- Select EKS → EKS Service as the trusted entity type.
- Attach the policy you just created (
CloudWatchContainerInsightsPolicy) to the role. - Name the role (e.g.,
EKSContainerInsightsRole).
3. Associate the IAM Role with EKS Service Account:
- In Amazon EKS, you need to associate this IAM role with the Kubernetes service account used by the pods that will send logs and metrics to CloudWatch.
- Use the following command to create a service account and bind it to the IAM role:
eksctl create iamserviceaccount \
  --name cloudwatch-agent \
  --namespace amazon-cloudwatch \
  --cluster <your-cluster-name> \
  --attach-policy-arn arn:aws:iam::<your-account-id>:policy/CloudWatchContainerInsightsPolicy \
  --approve
Step 2: Install and Configure CloudWatch Agent on EKS Pods
- Install CloudWatch Agent on the Cluster:
- Next, you need to deploy the CloudWatch agent to your EKS cluster, which will collect and send metrics and logs from your pods.
- You can use Helm or a Kubernetes manifest to deploy the agent. Here’s an example of using Helm:
helm repo add amazon-cloudwatch https://aws.github.io/amazon-cloudwatch-agent
helm install --name cloudwatch-agent amazon-cloudwatch/amazon-cloudwatch-agent \
  --set awsRegion=<your-aws-region> \
  --set clusterName=<your-cluster-name> \
  --set serviceAccount.create=false \
  --set serviceAccount.name=cloudwatch-agent
2. Configure the CloudWatch Agent:
- You will need a configuration file for the CloudWatch agent to specify what metrics and logs to collect.
- Create a
configmap.yamlfile with the following content:
apiVersion: v1
kind: ConfigMap
metadata:
  name: cwagentconfig
  namespace: amazon-cloudwatch
data:
  config.json: |
    {
      "logs": {
        "metrics_collected": {
          "kubernetes": {
            "cluster_name": "<your-cluster-name>",
            "metrics_collection_interval": 60,
            "enable_control_plane_logs": true
          }
        }
      }
    }
Apply this ConfigMap to your cluster:
kubectl apply -f configmap.yaml
3. Deploy the CloudWatch Agent DaemonSet:
- After configuring the agent, deploy it as a DaemonSet so that it runs on each node and collects metrics from all pods:
kubectl apply -f https://raw.githubusercontent.com/aws-samples/amazon-cloudwatch-container-insights/master/k8s/deployment/YOUR_DEPLOYMENT_FILE.yaml
Step 3: Verify Container Insights Setup
- In the AWS Management Console on the Services menu, click CloudWatch.
- In the left navigation menu under Container Insights, Select Service: EKS.
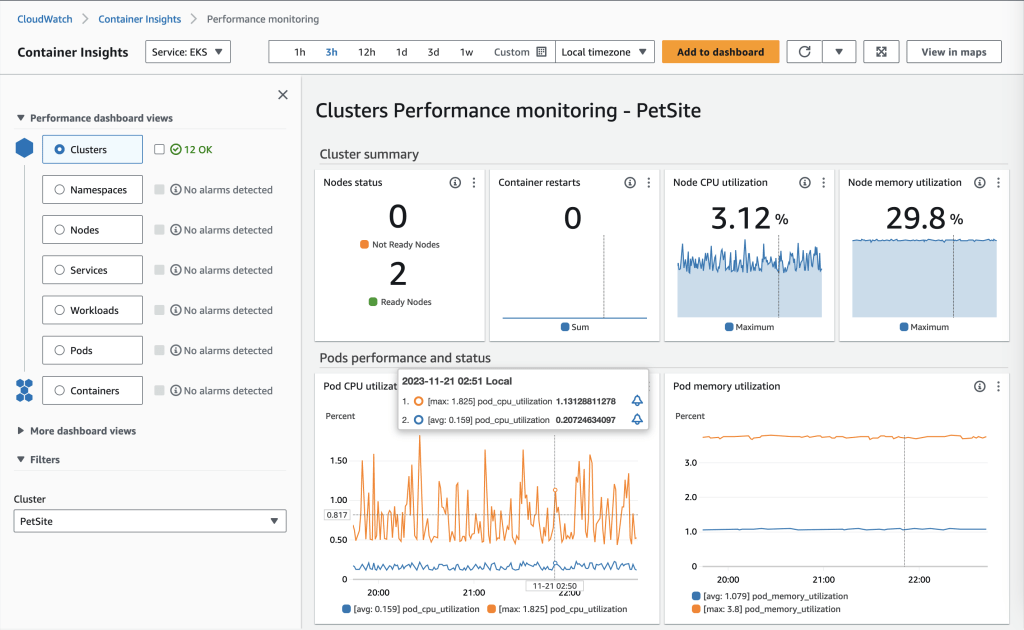
- Scroll down to the Clusters Overview section and select PetSite from the list of clusters.
This will return the performance monitoring of the selected cluster.
This monitoring dashboard provides various views to analyze performance, including:
- Cluster-wide performance dashboard view – Provides an overview of resource utilization across the entire cluster.
- Node performance view – Visualizes metrics at the individual node level.
- Pod performance view – Focuses on pod-level metrics for CPU, memory, network, etc.
- Container performance view – Drills down into utilization metrics for individual containers.
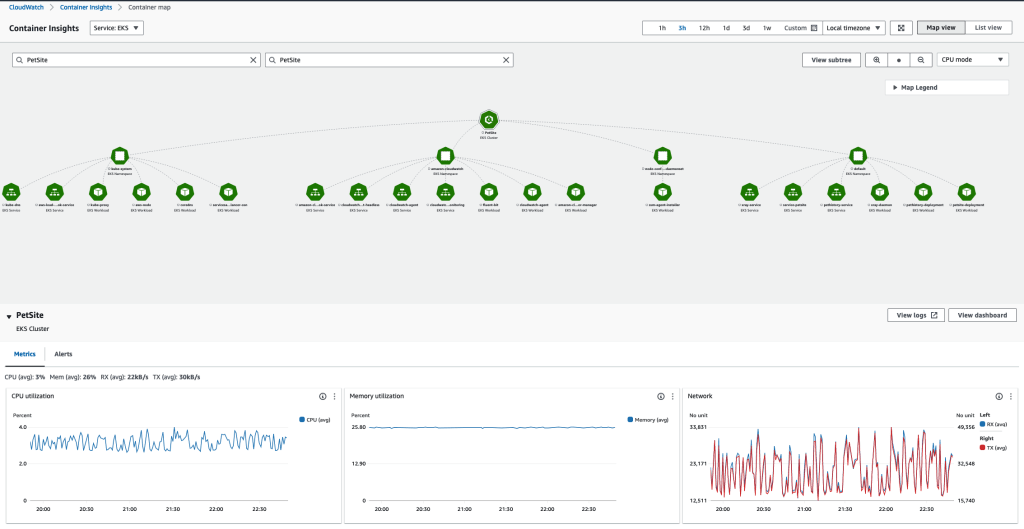
- Click on
View in Mapsin the top right corner.
This will show the cluster resources in a tree format.
- Select the node on the map.
This will cause critical metrics about the resource to appear at the bottom of the screen. In this example, you can see cpu, memory, and network related metrics aggregated at the cluster level.
Click the View Dashboard button located in the top right of the panel displaying the metrics.
- Click the
View Dashboardbutton located in the top right of the panel displaying the metrics.
Here you will be able to see the automatic performance dashboards created by CloudWatch Container Insights enhanced metrics for EKS. The Amazon CloudWatch Container Insights dashboards allow you to drill down into more detailed views to gain additional insights. we could start with the cluster-wide performance dashboard to get a high-level perspective. The different views allow methodically narrowing down to find the root cause, from cluster to node to pod to container.
- Clusters
- Namespaces
- Nodes
- Services
- Workloads
- Pods
- Containers
- Click on a few of the options listed above to view the different dashboards.

8. When you drill into container level details, the filters automatically populate with related components for that container. This gives visibility into containerized workloads from high-level monitoring to pod and container metrics. This visibility helps troubleshoot and optimize container performance.

Conclusion
By following these steps, you’ll have successfully set up Amazon CloudWatch Container Insights at the pod level in your EKS cluster, with all the necessary IAM roles in place for efficient metric and log collection. This setup provides you with valuable insights into the performance and health of your containerized workloads, enabling you to monitor, troubleshoot, and optimize resource utilization with ease.
As we continue our journey into container monitoring, stay tuned for our next blog, where we’ll dive into more AWS tools that can further enhance your visibility, such as AWS X-Ray and Managed Grafana. These tools will take your observability to the next level, helping you gain even deeper insights into your applications.
Keep up the great work—each step brings you closer to mastering AWS monitoring!

Leave a comment